Welcome to our tools page! At the Colorado Climate Center, we want to provide, not only data,
but also products that make that data useful for each user's needs. The tools and products
on this page can put Colorado's climate into a useful context for a variety of sectors,
such as agriculture or water and energy utilities. Keep checking back as we continue
to improve existing products and roll out new ones.
Have an idea for a new product you'd like to see on our page? Contact
Becky Bolinger!
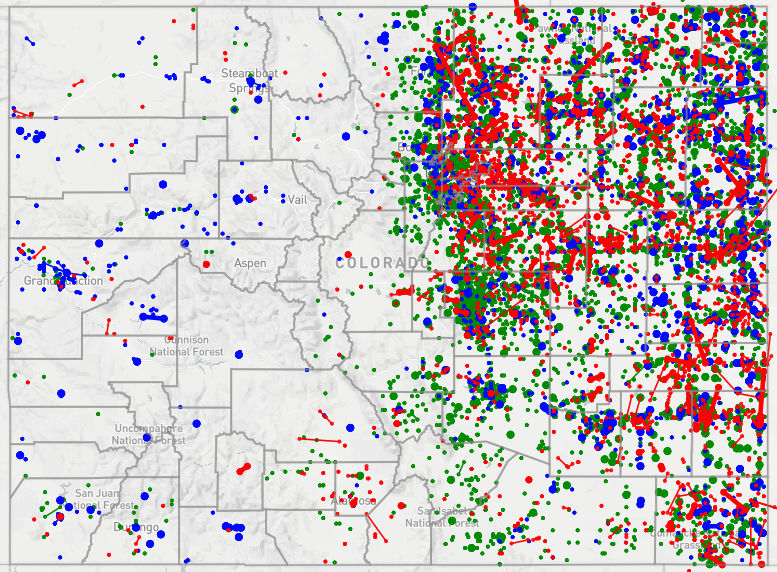 |
Explore this interactive map to see severe storm reports (hail, wind, tornadoes) for Colorado. This historical database
is provided by the Storm Prediction Center.
|
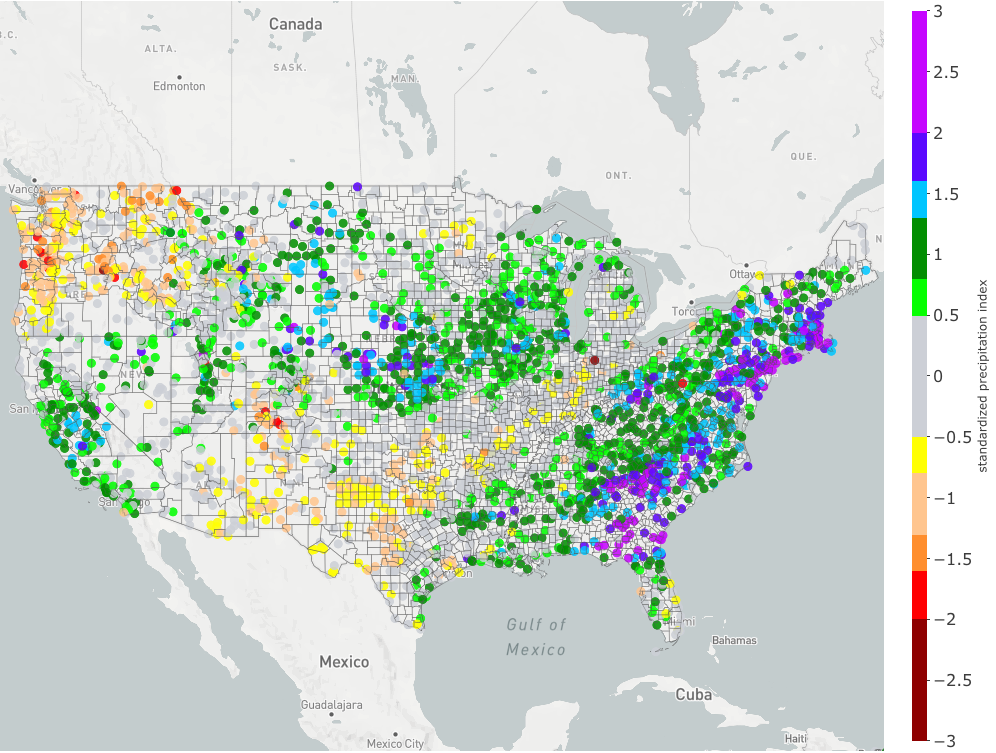 |
Standardized Precipitation Index is one of the most significant indicators of drought. This tool
is a mapping display of SPI across the country, with a color scale that matches the
U.S. Drought Monitor drought categories. Compare short- and long-term timescales of precipitation
anomalies. Zoom into specific regions of the country. Alaska, Hawaii, and Puerto Rico included!
|
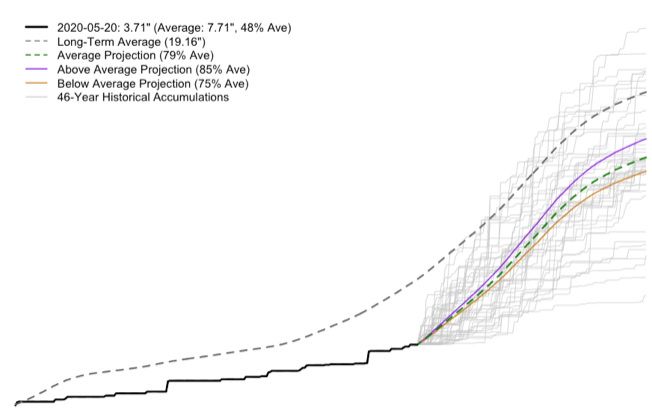 |
For high-quality, long-term stations around the state, view precipitation projections for the current water year.
Graphs show how precipitation normally accumulates through the water year, how it's currently accumulating, and
what's possible for the remainder of the water year.
|
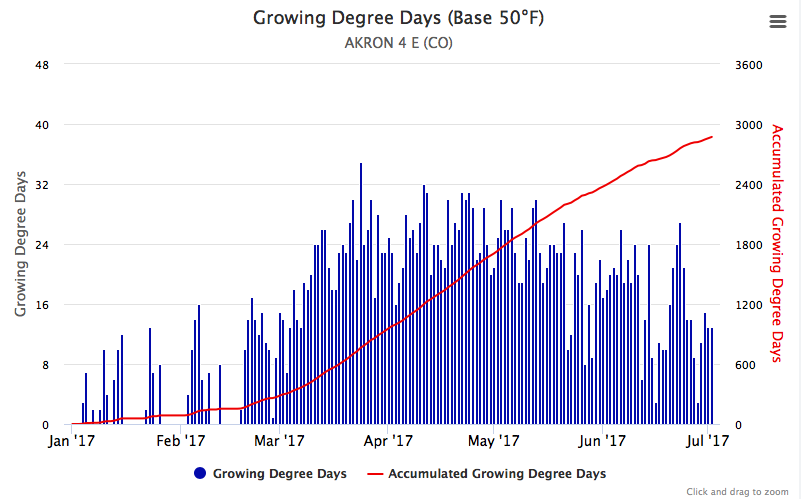 |
Select a station, start date, end date, and base temperature. The resulting chart will
display daily and accumulated growing degree days.
|